
About Me
A problem-solver at heart, a strategist in mind, and a creative soul in action.Hi, I'm Aditya!I'm a data-driven professional with a background in Talent, Operations, Supply Chain and Healthcare, passionate about technology, analytics, and operational efficiency. I bridge the gap between business and technology, crafting solutions that enhance decision-making and optimize workflows.
Skills

Tableau | Smartsheet | Power BI | MS Excel | R | Confluence | SharePoint | Python | Visio | MS Access | Machine Learning | SQL
Featured Projects

MySQL | Unlocking Insights | Analyzing World Life Expectancy
Recently, I worked on a data cleaning and exploratory data analysis (EDA) project using MySQL Workbench to analyze global life expectancy trends.

Power BI | Hospital ER Data Analysis
Developed an interactive Power BI dashboard to analyze patient visits, wait times, and satisfaction scores across multiple ER departments, optimizing hospital operations and patient experience.
ML Modeling using R Predicting & Preventing Loan Defaults
Developed a machine learning-based loan approval automation system to predict loan defaults, estimate loan amounts, and profile high-risk applicants for a bank's consumer credit department. Used classification, regression, and clustering models to improve decision-making and minimize financial risk.

ML Modeling using R Market Segmentation: Optimizing Customer Targeting
Built a dynamic customer segmentation model using machine learning, incorporating clustering, classification, and predictive analytics to help businesses identify high-value customers, optimize promotions, and drive brand loyalty.
Well-Being
Beyond Work: A Life of Passion & Impact
While my career keeps me engaged in solving complex problems, my well-being and community involvement are just as important.

MySQL | Unlocking Insights | Analyzing World Life Expectancy
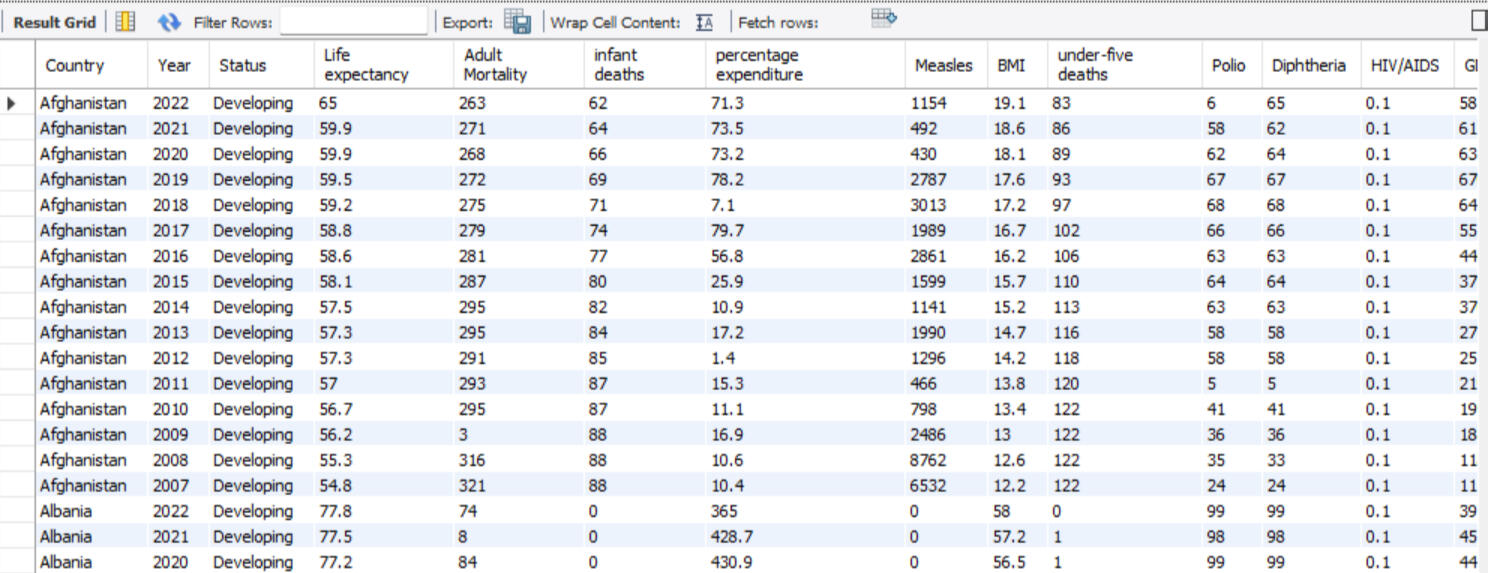
Recently, I worked on a data cleaning and exploratory data analysis project using MySQL Workbench. In this project, I examined global life expectancy trends and their relationship with socioeconomic factors. The dataset covered multiple years, spanning across developed and developing nations, and included indicators such as GDP, adult mortality, Adult Mortality and BMI.By cleaning, transforming, and analyzing this dataset, I identified key trends that explain why certain countries have longer life expectancy than others and how high/low GDP impacts life expectancy.Questions I Was Interested in Answering:
1. Are there missing values, duplicates, or data quality issues that could impact our analysis?
2. What is the correlation between GDP and life expectancy?
3. How does life expectancy vary between developed and developing countries?
4. Can we observe trends in mortality and life expectancy over time?
5. How does BMI relate to life expectancy, and are there any interesting patterns?Steps I Took to Create My Analysis:Data Cleaning & Preprocessing1. Checked for duplicates using a concatenated Country-Year key
2. Identified missing values and imputed them using self-joins (e.g., filling in missing life expectancy values by averaging previous and next years)
3. Ensured consistency in the Status (Developed/Developing) column by updating blank entries based on existing country recordsExploratory Data Analysis (EDA)1. Analyzed trends in life expectancy across different years
Investigated the impact of GDP on life expectancy, finding a strong positive correlation
2. Examined the distribution of developed vs. developing countries and their average life expectancy
3. Explored BMI and adult mortality trends, observing outliers and potential data quality issuesRolling Totals & Insights1. Computed cumulative adult mortality over the years to assess patterns in different countries
2. Identified possible data inconsistencies in the mortality column
3. Generated insights that could be further visualized in Power BI for better storytellingKey Takeaways:
1. Higher GDP is associated with higher life expectancy, reinforcing the link between economic stability and public health
2. Developed countries have higher life expectancy, but their representation is much smaller (32 vs. 161 developing countries)
3. BMI shows mixed patterns, with some high-BMI countries having longer life expectancy, while extremely low BMI correlates with lower life expectancy
4. Rolling total analysis of adult mortality revealed potential outliers, prompting further investigationWhat are the next steps based on BI & Predictive Modeling:
1. Build a predictive model to forecast life expectancy based on GDP, BMI, and other socioeconomic factors
2. Visualize the trends using Power BI to make the findings more interactive and accessible
3. Explore regional disparities in healthcare and longevity by diving deeper into country-level trends
POWER BI | Hospital ER Data Analysis
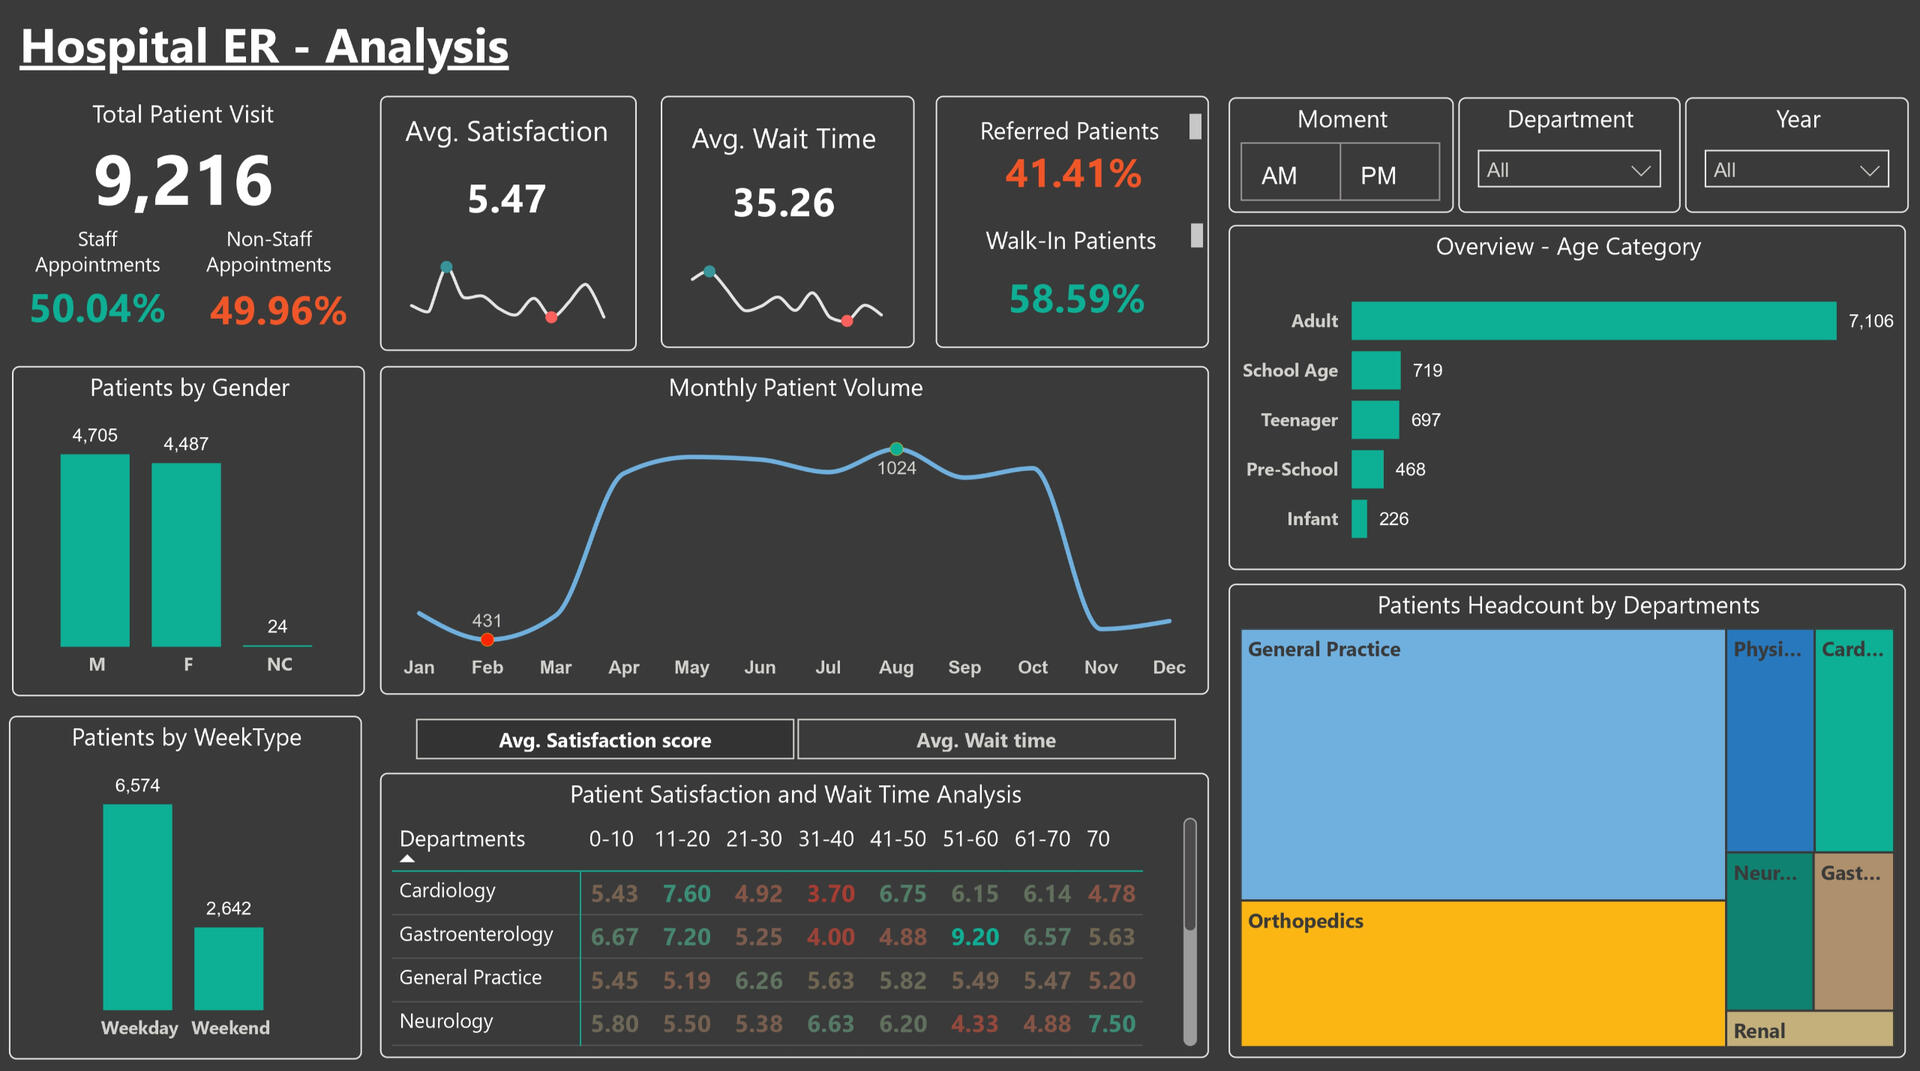
Developed a Power BI dashboard to analyze ER patient visits, wait times, and satisfaction scores, helping hospital management improve operational efficiency and patient experience. Implemented data transformations and role-based security (RLS) to ensure controlled data access.Questions I Was Interested in Answering:
1. How do wait times impact patient satisfaction across different ER departments?
2. What is the patient volume trend across different months, times of day, and week types?
3. Are there differences in walk-in vs. referred patients in terms of wait times and satisfaction?
4. Which departments have the longest wait times, and how does that correlate with satisfaction?
5. How does patient demographic data (age, gender) affect ER visits and satisfaction levels?Steps I Took to Create My Analysis:
1. Pulled data from an Excel source containing ER visit details.
2. Performed data transformations to clean and structure patient visit data for accurate insights.
3. Created interactive visualizations in Power BI to analyze wait times, satisfaction scores, and patient trends.
4. Implemented Role-Level Security (RLS) so that departments see only their own data, while higher management accesses full hospital insights.
5. Developed KPIs and comparisons to highlight performance differences across ER units.Key Takeaways:
1. Satisfaction drops as wait times increase, especially in Cardiology & Neurology departments.
2. Walk-in patients experience longer wait times than referred patients, impacting satisfaction.
3. Weekends see a lower patient volume but longer average wait times, likely due to staffing constraints.
4. General Practice handles the highest patient load, while Gastroenterology shows the highest satisfaction.
5. RLS implementation ensured secure and hierarchical data access, maintaining confidentiality.The dashboard is dynamic and adjusts depending on the year(s), department(s), time of visit, and demographics.
ML Modeling using R Predicting & Preventing Loan Defaults
Developed a machine learning-based loan approval automation system to predict loan defaults, estimate loan amounts, and profile high-risk applicants for a bank's consumer credit department. Used classification, regression, and clustering models to improve decision-making and minimize financial risk.Questions I Was Interested in Answering:
1. Can we accurately predict whether an applicant will default on a home improvement loan?
2. What is the optimal loan amount that minimizes default risk while retaining applicants?
3. How do factors like employment status, debt-to-income ratio, and credit history influence default probability?
4. Can we group applicants into risk-based profiles to assist in loan approval decisions?
5. How can we automate the loan approval process while maintaining transparency and compliance with lending regulations?Steps I Took to Create My Analysis:
1. Pulled data from a CSV source containing 5,960 loan applications with financial and credit history details.
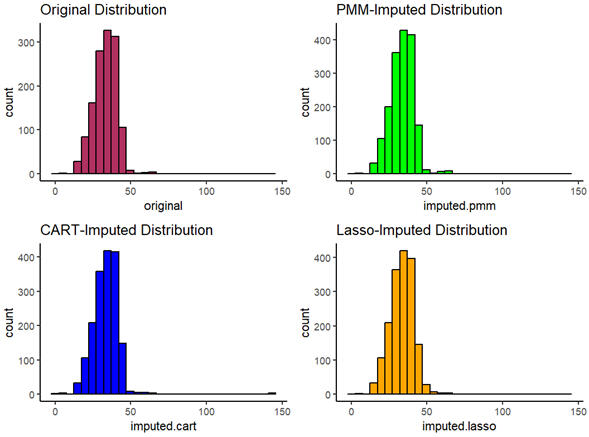
2. Identified missing values in key variables (debt-to-income ratio, employment status, mortgage due, and property value) and used MICE imputation to maintain data integrity.
3. Performed feature transformations, including scaling, encoding categorical variables, and log transformations to improve model accuracy.
4. Built classification models (Logistic Regression, Decision Tree, Random Forest) to predict loan defaults with an accuracy of up to 89.46%.
5. Developed regression models to estimate loan amounts, but found high RMSE values, indicating a need for additional predictive variables.
6. Implemented clustering (K-Means) to create risk-based applicant profiles, identifying high-risk borrowers and helping the bank refine approval strategies.
7. Evaluated models based on accuracy, sensitivity, specificity, and RMSE, ensuring robust decision-making.Key Takeaways:
1. Random Forest (89.46% accuracy) outperformed other models in predicting loan defaults, but Decision Tree was preferred for its interpretability.
2. Applicants with high delinquent credit lines and derogatory reports had a significantly higher probability of default.
3. Debt-to-income ratio was the strongest predictor of default risk, emphasizing the need for better risk assessment criteria.
4. Cluster analysis revealed three key borrower profiles – low-risk, moderate-risk, and high-risk, helping the bank optimize loan approvals.
5. Automating loan approval decisions with machine learning reduces bias, enhances transparency, and ensures compliance with the Equal Credit Opportunity Act (ECOA).
ML Modeling using R
Market Segmentation: Optimizing Customer Targeting
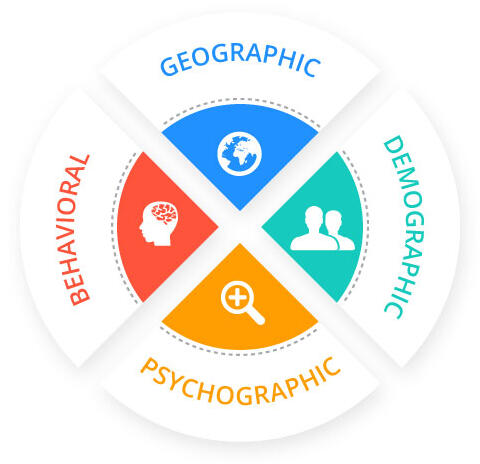
Conducted customer segmentation analysis using machine learning for AXANTEUS, a Thai market research firm, to optimize promotional strategies based on brand loyalty, price sensitivity, and purchasing behaviors. Utilized clustering, classification, and predictive modeling to enhance targeted marketing and brand engagement.Questions I Was Interested in Answering:
1. How can we segment customers based on their purchasing behaviors, brand loyalty, and price sensitivity?
2. Which customer segments are most likely to respond to promotions and discounts?
3. Can we predict if a customer is brand-loyal or price-conscious using machine learning?
4. How do customer demographics (age, income, household size) influence purchasing decisions?
5. What insights can help AXANTEUS's client optimize their promotional budget and improve marketing ROI?Steps I Took to Create My Analysis:
1. Pulled data from a CSV source containing 600 customers and 46 attributes, including demographics and purchase behaviors.
2. Handled missing values by identifying types of missing data and applying data imputation strategies.
3. Performed data transformations including feature scaling, dummy encoding, and dimensionality reduction (PCA).
4. Used clustering algorithms (K-Means, Hierarchical Clustering) to segment customers based on brand loyalty and purchase behaviors.
5. Built classification models (Logistic Regression, Decision Tree, C5.0) to predict value-conscious customers.
6. Developed regression models (Linear Regression, CART) to predict brand loyalty (Brand Runs) and frequent purchases.
7. Evaluated models based on accuracy, sensitivity, specificity, and RMSE for predictive performance.
Key Takeaways:
1. Identified three key customer segments – Brand Loyalists, Promo Enthusiasts, and Balanced Shoppers, helping target personalized marketing.
2. Promotional dependency plays a major role – value-conscious customers base purchases on discounts, while loyal customers prioritize brand consistency.
3. Customer segmentation based on purchase behavior enables AXANTEUS to optimize advertising budgets and reward programs for high-value segments.
4. Classification models (C5.0 & Decision Tree) were highly effective in predicting value-conscious customers, with 99% accuracy.
5. Regression models helped predict brand loyalty, allowing businesses to design loyalty programs and promotional strategies for high-retention customers.
Well-Being & Beyond: My Journey Outside Work


To me, well-being isn’t just about fitness or relaxation, it’s about engaging in activities that bring fulfillment, joy, and continuous learning. By nurturing my passions outside of work, I stay motivated, creative, and energized in everything I do.Sketching & Creativity: Expressing Ideas Visually
Art is my creative escape, allowing me to translate thoughts into visuals. Whether it's freehand sketches, illustrations, or digital art, I find joy in creating something from scratch. Just like in analytics, where patterns tell stories, sketching lets me capture emotions and perspectives in a unique way.- Encourages out-of-the-box thinking
- Enhances attention to detail
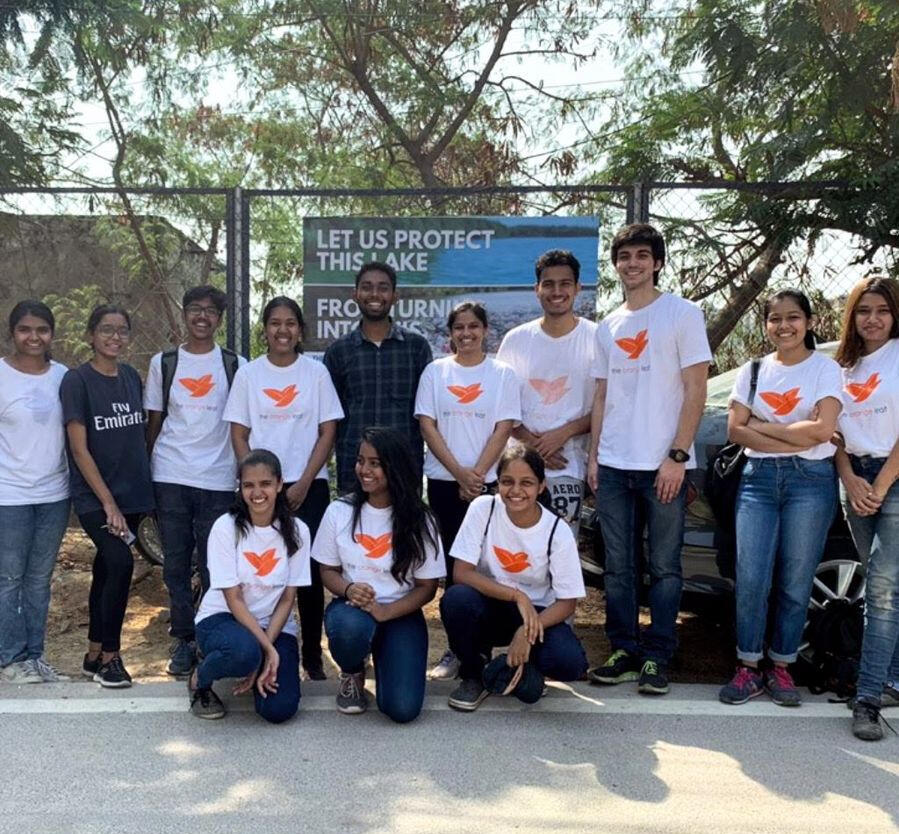
- Provides a calming experienceNonprofit & Volunteering: Giving Back to the Community
Beyond work and hobbies, I dedicate time to nonprofit initiatives, particularly in child sexual abuse and mental health. Making a difference, no matter how small, brings immense fulfillment and purpose. I strive to use my skills and time to support causes that truly matter.- Volunteering for awareness and education programs for child sexual abuse and mental health. Also, supporting social impact projectsSports & Fitness: Staying Active, Staying Strong.....
Sports have always been an integral part of my life. They keep me disciplined, resilient, and focused. These traits seamlessly translate into my professional work. Whether it’s a friendly match or a solo workout, I thrive on the energy and mental clarity that physical activity provides.- Keeps me motivated and disciplined
- Enhances focus and decision-making skills
- Teaches teamwork and strategy